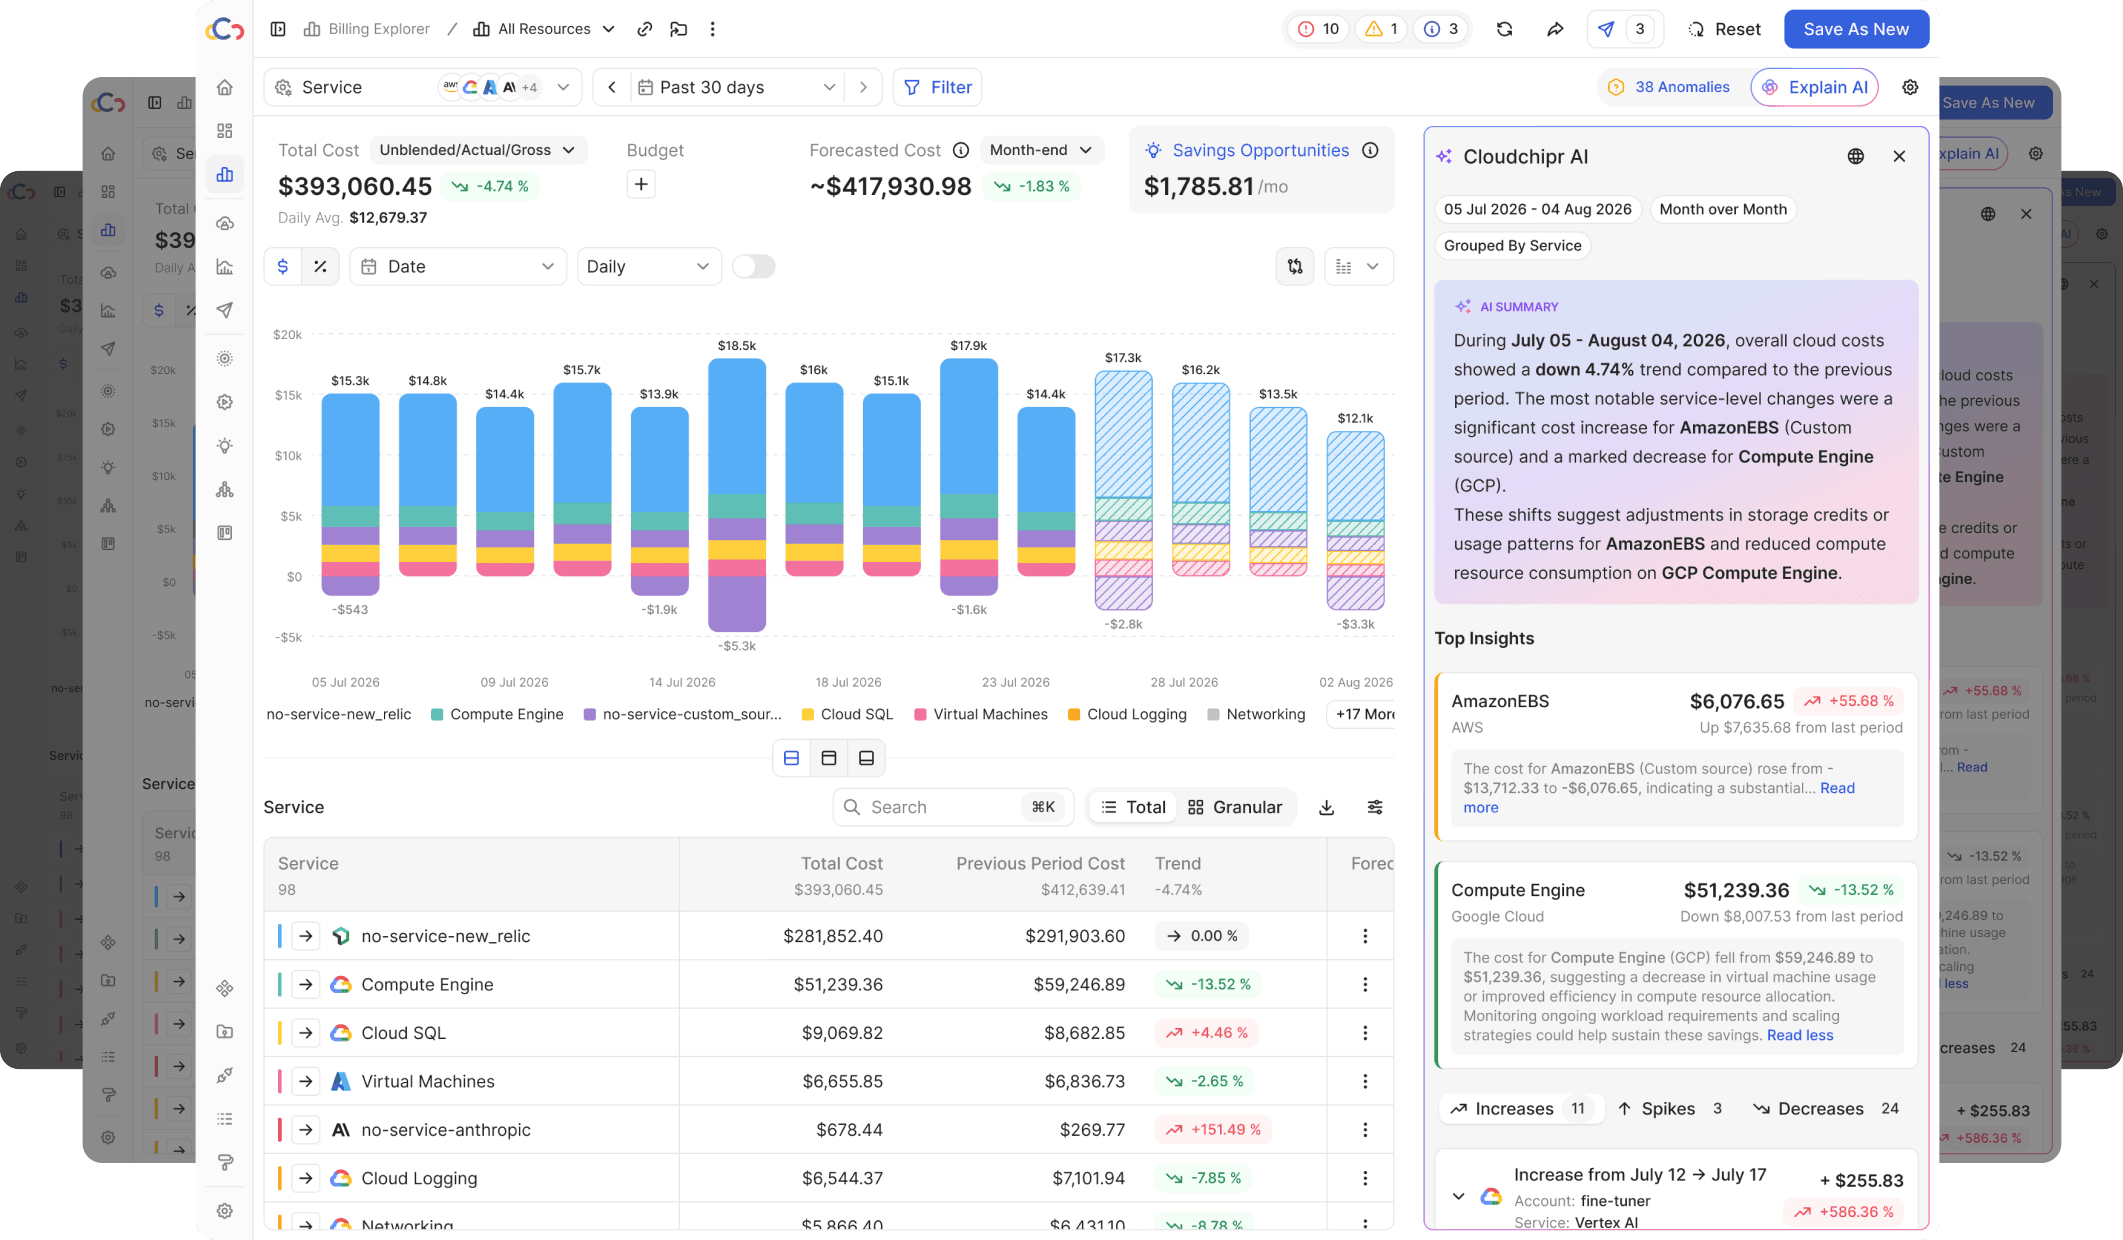
Cloudchipr from 0→1 cloud cost management platform

Role
Founding Product Designer
later Head of Product Design
Timeline
2023-Present
Team
3 Founders
8 Engineers
10 SREs
2 Product Designers
What I did
Product Strategy
Product Design
User Research & Testing
Design Systems
AI & LLM Workflows
Code-based Prototyping
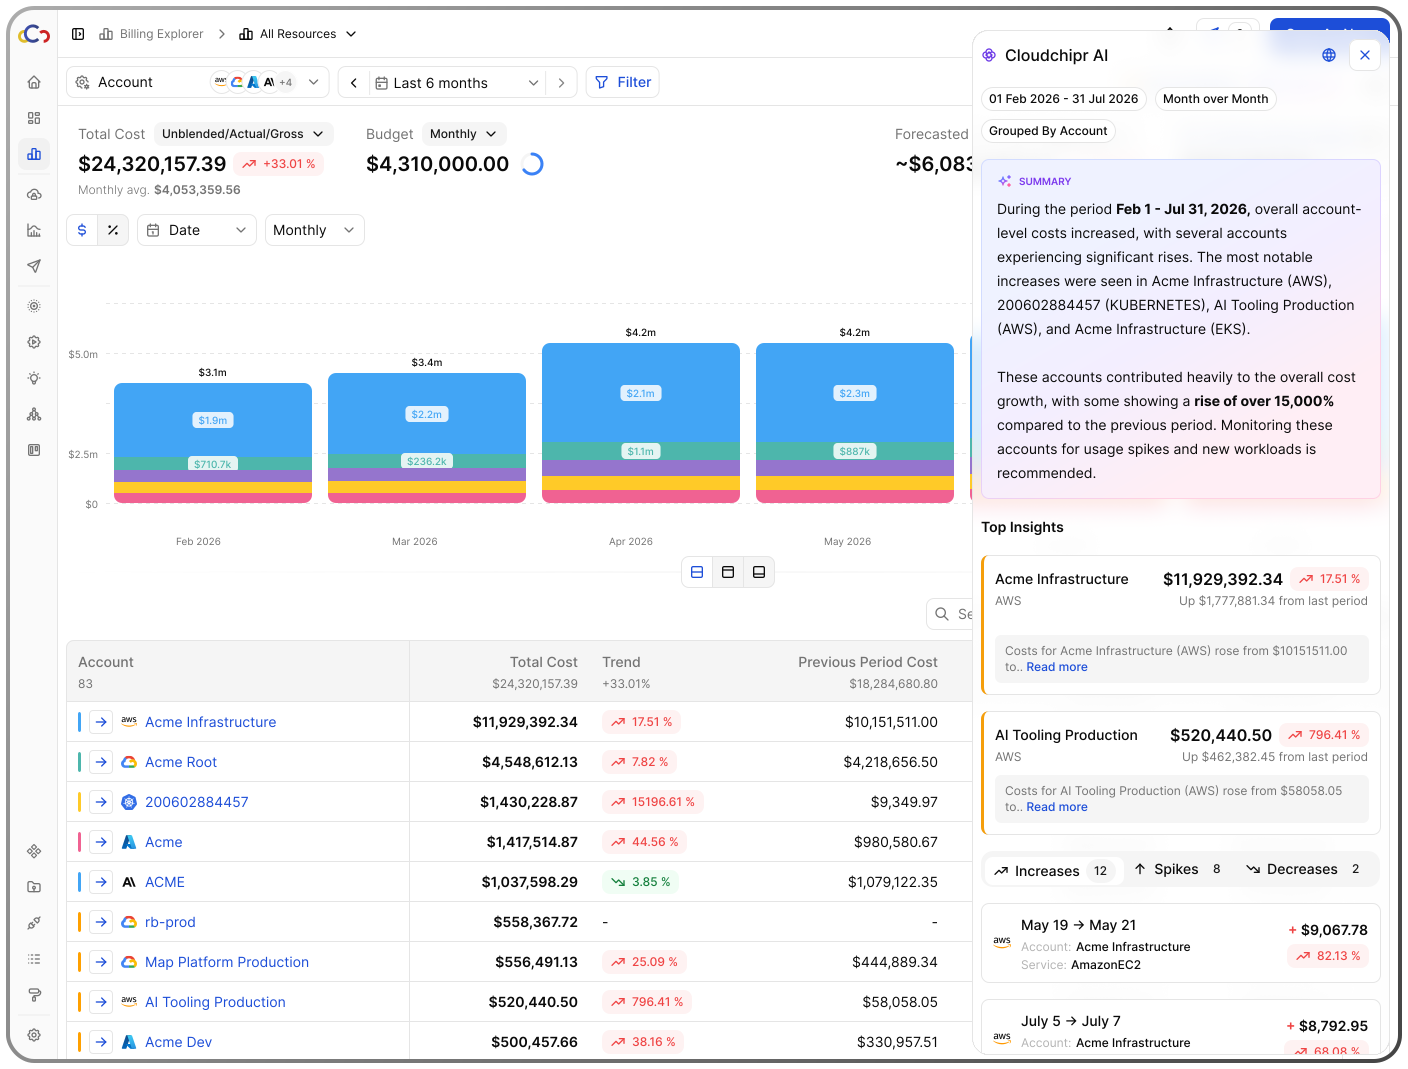
Role
Founding Product Designer
As founding product designer, I partnered directly with founders, customers, and engineers, established the design system, meanwhile managing two designers while remaining hands-on in the product.
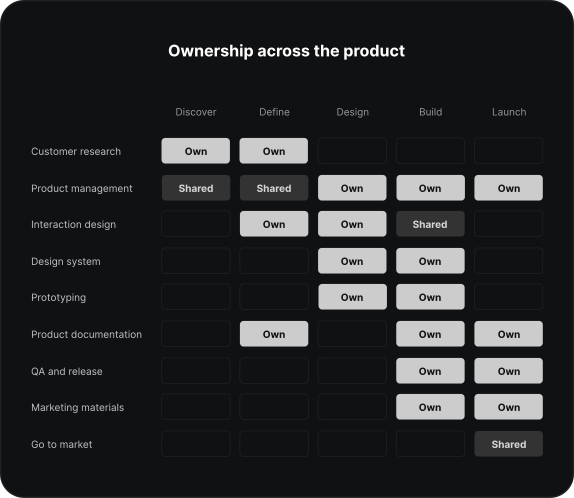
- 1 Discover
- 2 Define
- 3 Design
- 4 Build
- 5 Launch
| Activity | Discover | Define | Design | Build | Launch |
|---|---|---|---|---|---|
| Customer research | Own | Own | Not involved | Not involved | Not involved |
| Product management | Shared | Shared | Own | Own | Own |
| Interaction design | Not involved | Own | Own | Shared | Not involved |
| Design system | Not involved | Not involved | Own | Own | Not involved |
| Prototyping | Not involved | Not involved | Own | Own | Not involved |
| Product documentation | Not involved | Own | Not involved | Own | Own |
| QA and release | Not involved | Not involved | Not involved | Own | Own |
| Marketing materials | Not involved | Not involved | Not involved | Own | Own |
| Go to market | Not involved | Not involved | Not involved | Not involved | Shared |
Challenge
Scale design, learn Cloud domain, own product decisions, and maintain delivery speed.
Solution
Introduced lightweight processes, built domain expertise, and established clear ownership and delivery standards.
Reactive delivery
- No dedicated PM or established product process
- Customer requests moved directly into delivery based on rough sketches.
- Limited discovery and testing
- Inconsistent design files and handoff

Structure without slowing down
- Research and discovery
- Grooming and focused brainstorming
- Baseline requirements with space to explore
- Clear design process
More intentional delivery
- Clearer problems and requirements
- More informed design decisions
- Consistent files, reviews, and handoff
- A shared quality bar for the team
Overview & challenge
Infra cost complexity is difficult to understand and act on
FinOps teams could see their cloud spending, but struggled to understand why it changed, who owned it, and what action to take.

These insights come from 30+ customer demos, interviews, and calls, along with market analysis and FinOps Foundation resources.






Core Persona

FinOps Practitioner
Connects engineering, finance, and business teams around cloud spend.
Works in an organization with $10K to $1M+ in monthly cloud spend across multiple providers, accounts, and teams.
Learn More about FinOps Practitioner persona
Objectives
Manages cloud costs across multiple providers, accounts, teams, and services, often at $10K to $1M+ in monthly spend.
KEY QUESTIONS
What changed, what caused it, which team or resource owns the cost, and whether the change requires action.
RESPONSIBLE FOR
Cloud billing consoles, spreadsheets, internal reports, Slack conversations, engineering teams, and finance workflows.
DEPENDS ON
FinOps can identify the issue and recommend an action, but engineering teams own the resources and make the actual changes.
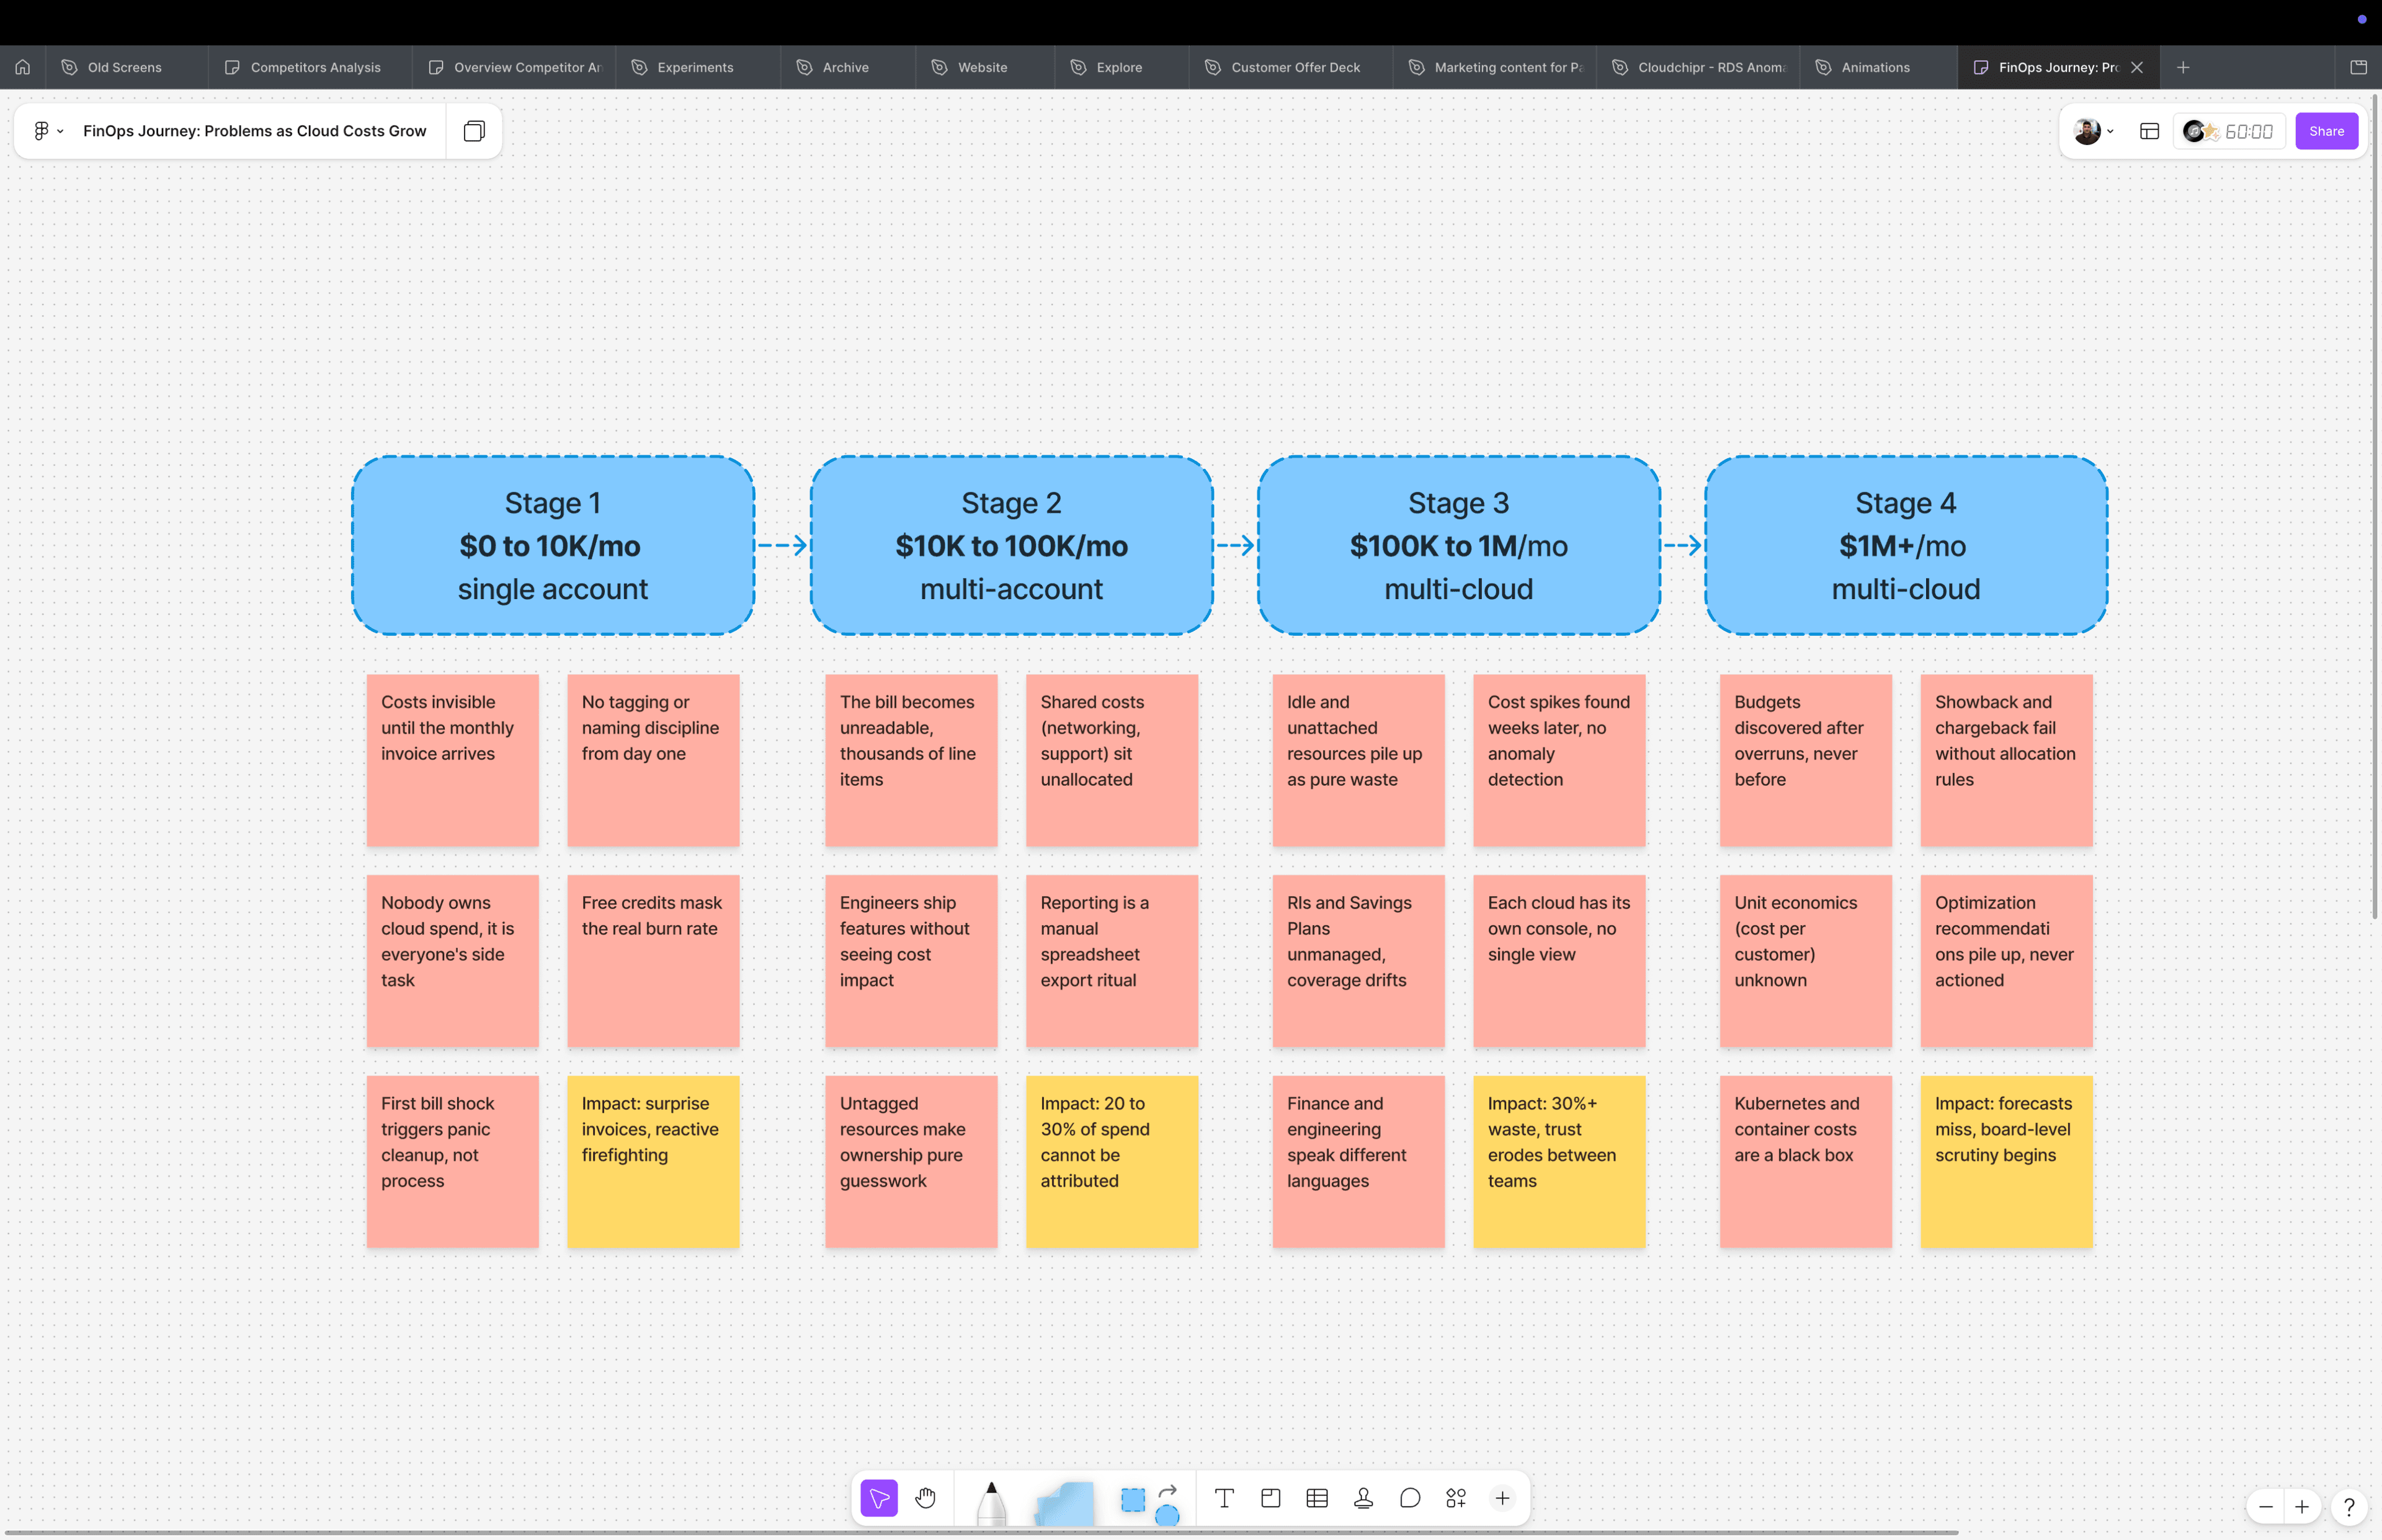
Where the problem becomes urgent
Cloud-cost pain compounds with scale. Cloudchipr customers sit in the last 3 stages, where manual investigation stops working.
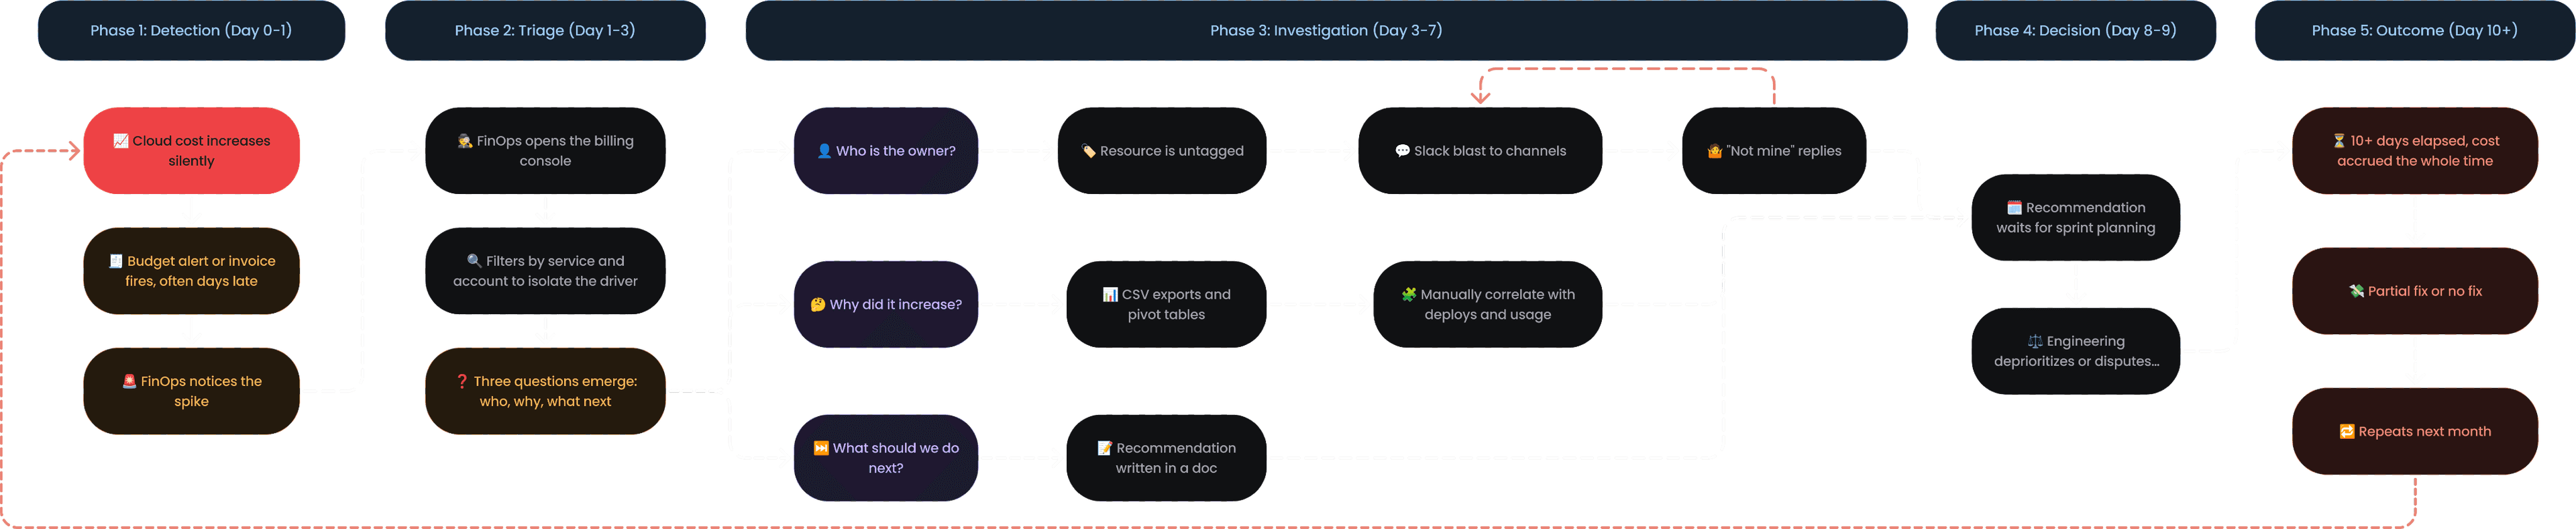
How it happens
10+
days
One Cloud cost spike, investigated by hand
Mapped from customer interviews. A single anomaly moved through five phases and four teams before anyone could act on it, and the spend accrued for the entire journey.
We organized the product around three questions
WHY
Why did costs change?

WHO
Who owns the cost?
NEXT
What should we do next?


Fragmented cost data
Each provider and service reported costs differently, forcing teams to reconcile data across consoles and spreadsheets.


Limited root-cause support
Billing tools showed that costs changed but rarely explained why. Teams had to investigate services and resources manually.


Unclear cost ownership
Infrastructure rarely reflected business structures, making it difficult to assign spending to teams, products, or initiatives and track team budgets.


Unclear savings actions
Teams lacked clear guidance on where costs could be reduced and what actions were needed to realize those savings.
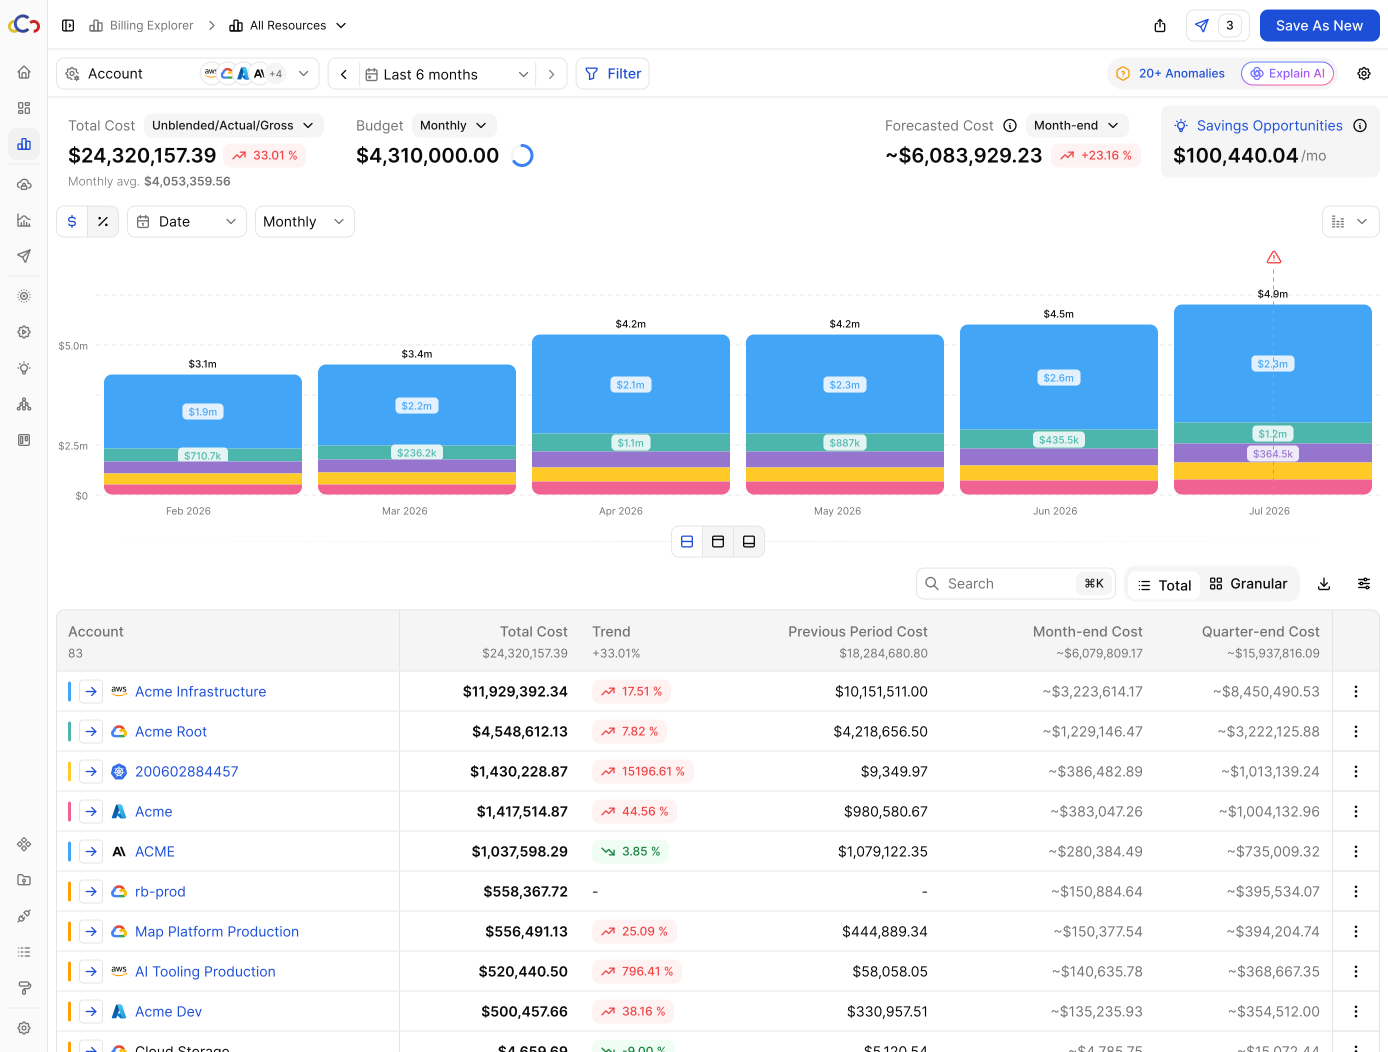
Key Decisions: Billing Explorer
Turning cost data into an investigation workflow
The Problem
Cloud cost tools often present totals, charts, and tables without helping users explain what contributed to a change. FinOps teams still have to move between disconnected views to isolate the service, resource, or owner behind a spike.


The Decision
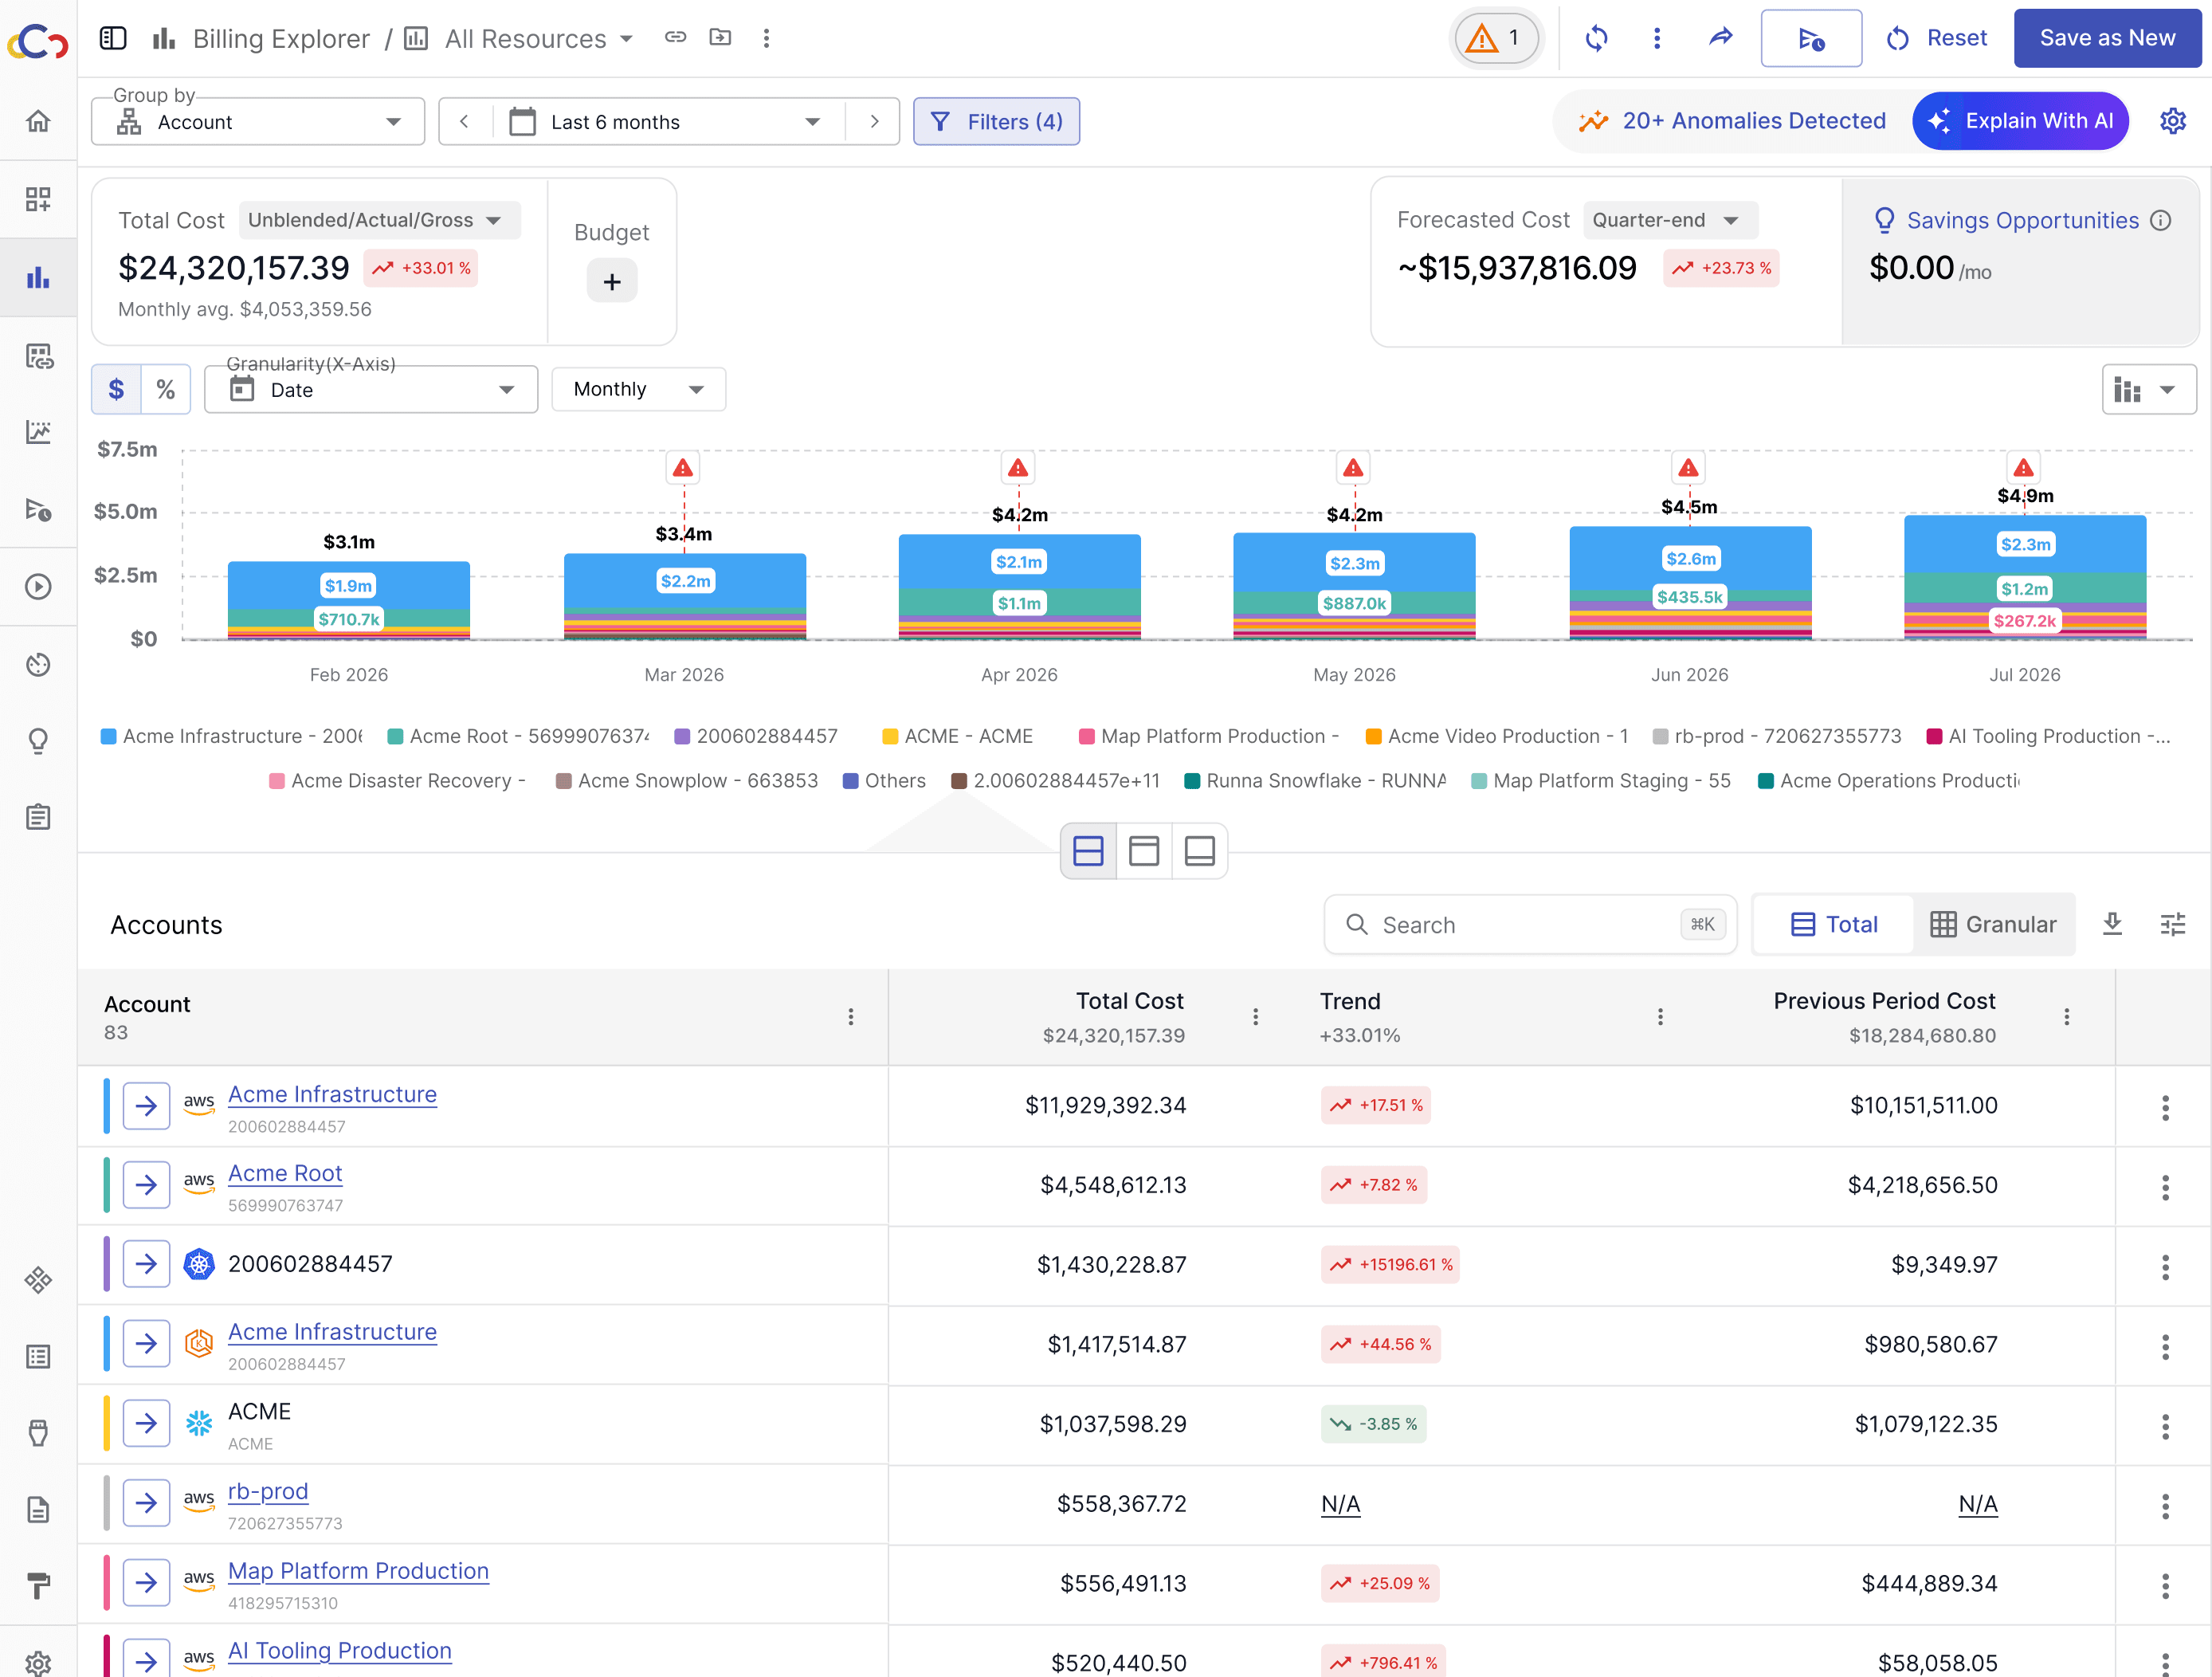
I designed Billing Explorer as a progressive, all-in-one investigation tool. Users could start with a change in the trend, narrow it to a service, inspect the resources, resource owners, and continue toward action without jumping to other tools.
Why it Mattered
The product became more than a place to read cloud bills. It became a workspace for moving from signal to explanation: trend → service → resource → owner
Evolution of Billing Explorer
UX decisions behind every single component
This section breaks down how individual components help users move from high-level cost visibility to deeper investigation and action.
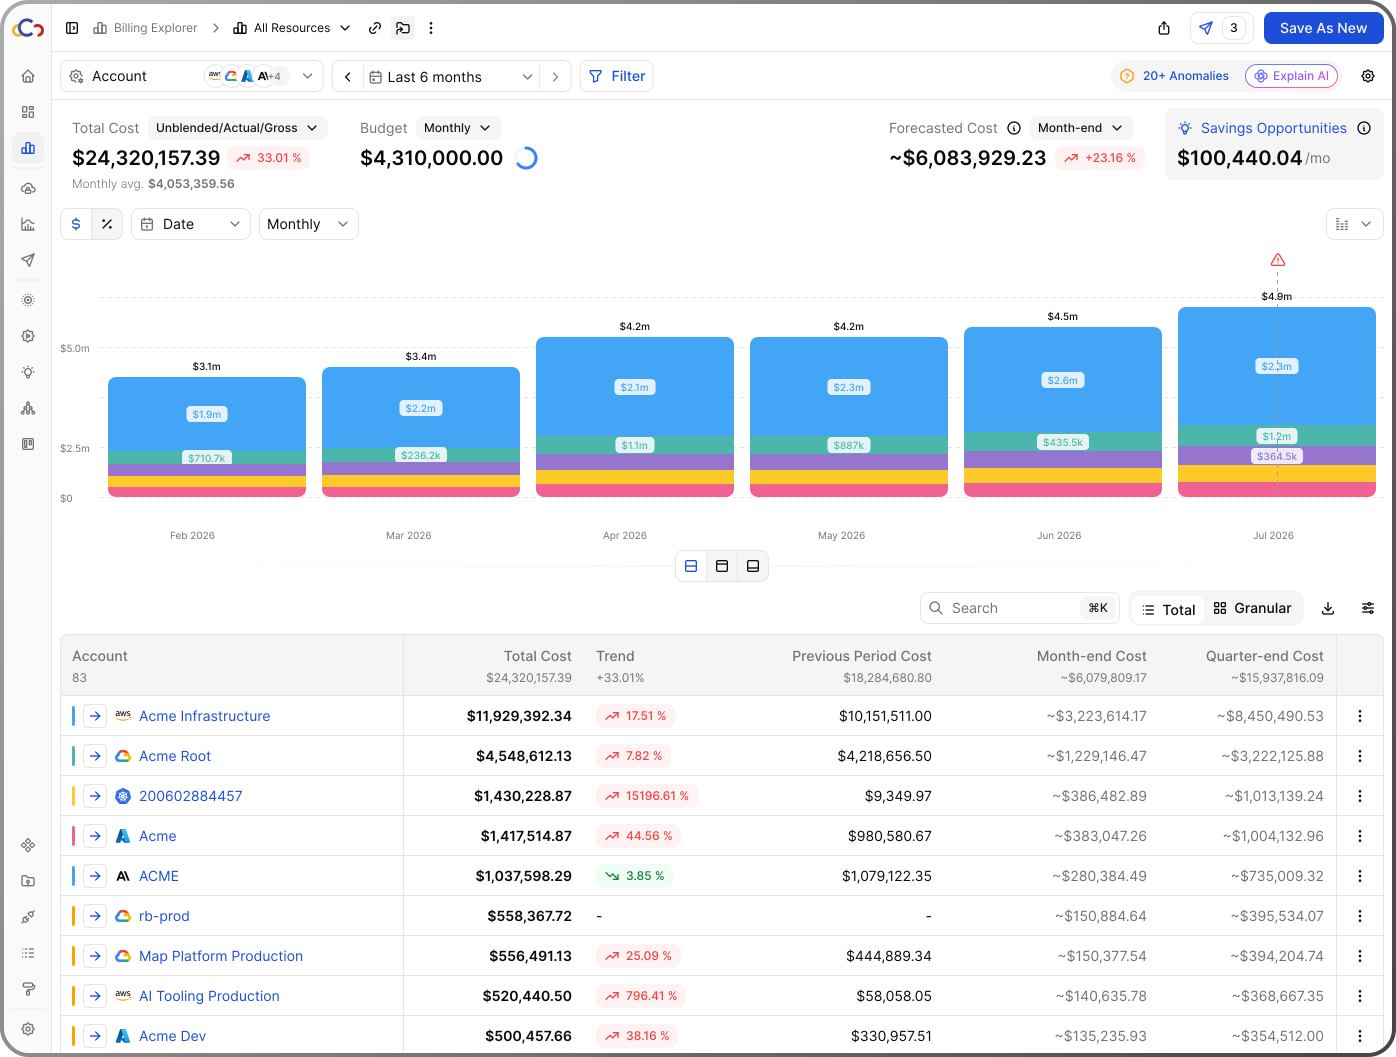
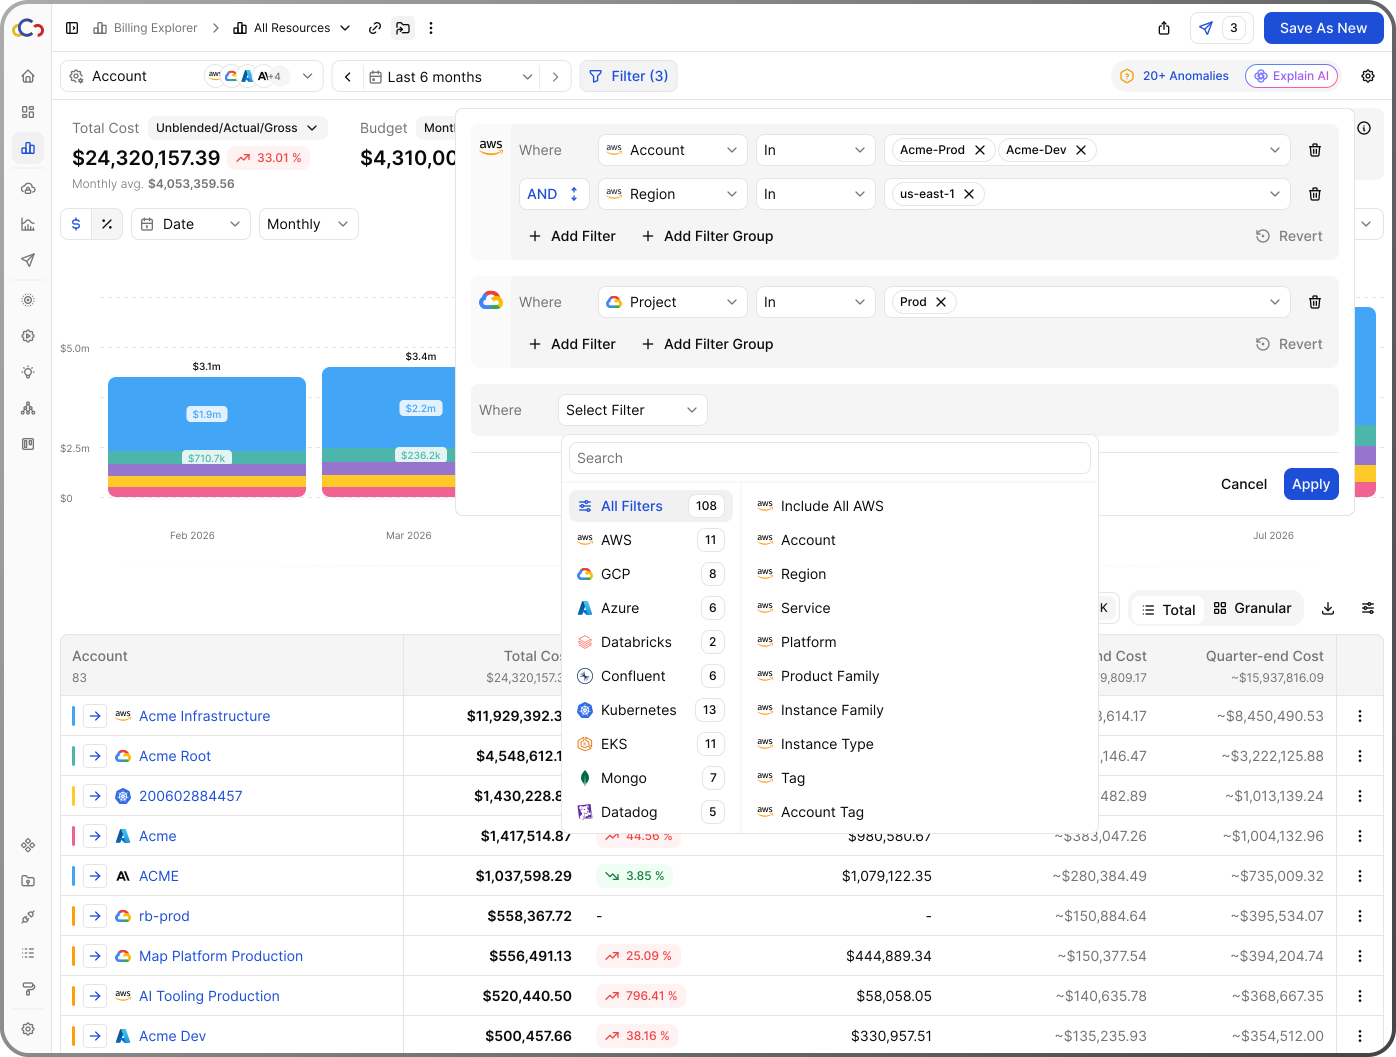
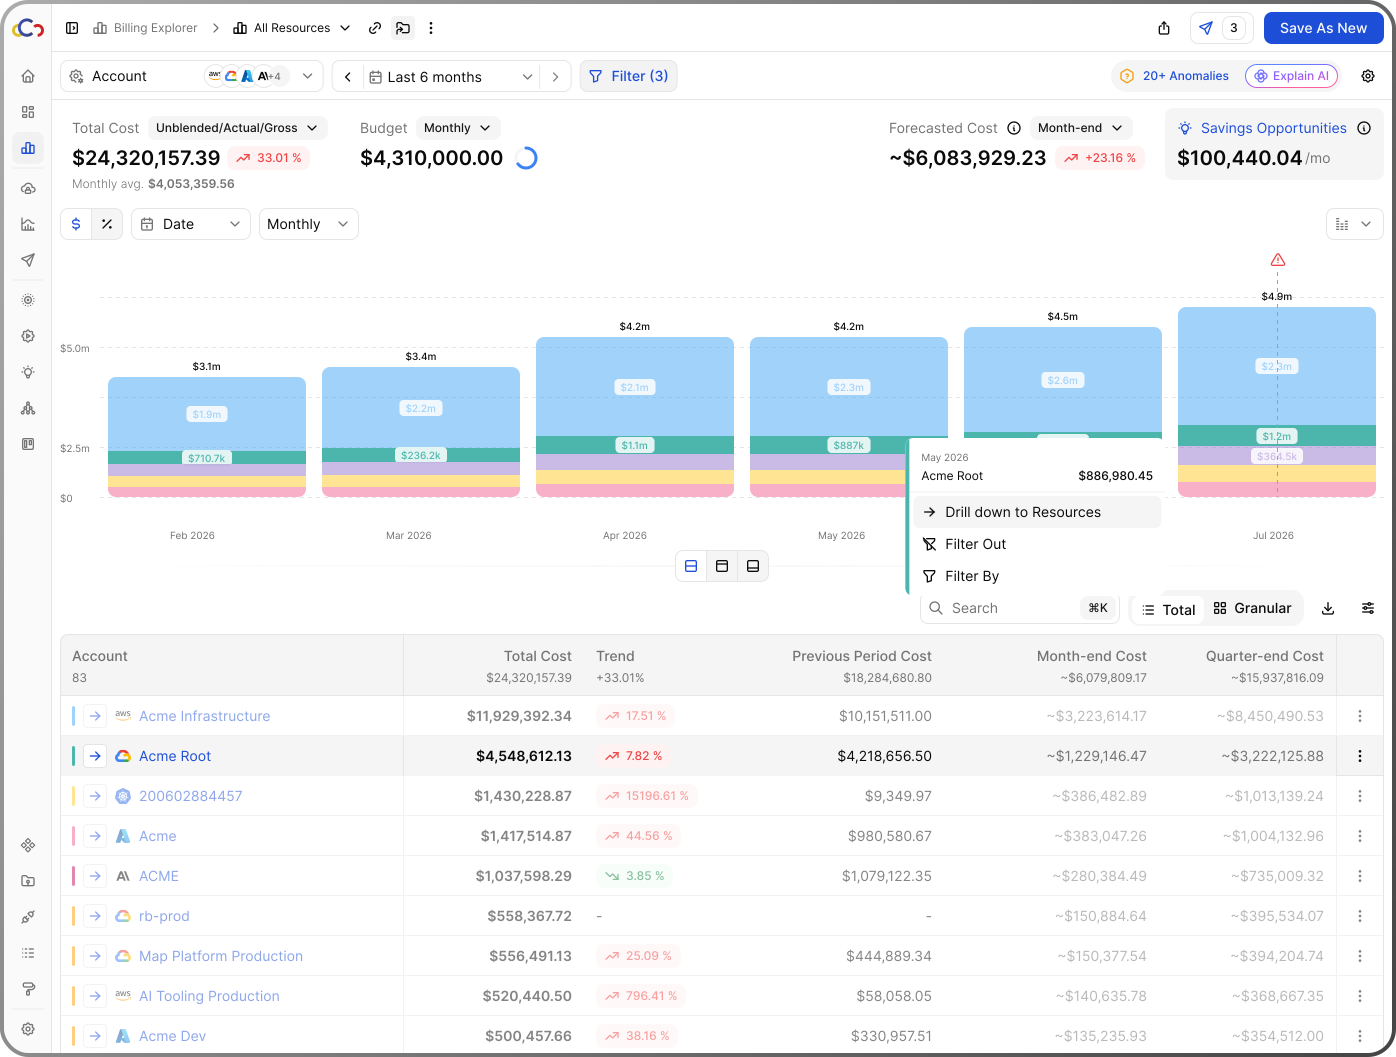
Chapter 1 / 7
Orient and share
Tap a note to frame it on the screen above.
- 01
Navigate the report hierarchy
Use breadcrumbs to understand where you are, move between report levels, access quick actions, and open additional report options.
- 02
Save, share, and subscribe
Save the current analysis as a report, send it to others, or subscribe to receive updates automatically.
Chapter 1 of 7: Orient and share
Dimensions
Organizing cloud costs around the business
The Problem
Customers needed a fully flexible allocation system that matched how their business operated, not only provider accounts and technical hierarchies.
The Decision
For the MVP, we focused on the smallest model that could cover the most common allocation needs. Dimensions let teams create business-relevant groupings, apply rules, and use those groupings consistently across cost analysis. As usage exposed more complex allocation needs, we introduced telemetry-based and dynamic Dimension types.
Why it Mattered
Dimensions made cloud costs match how the business was actually organized, creating a consistent structure for ownership and analysis.
100%
Dimensions became part of the workflow for all customers.
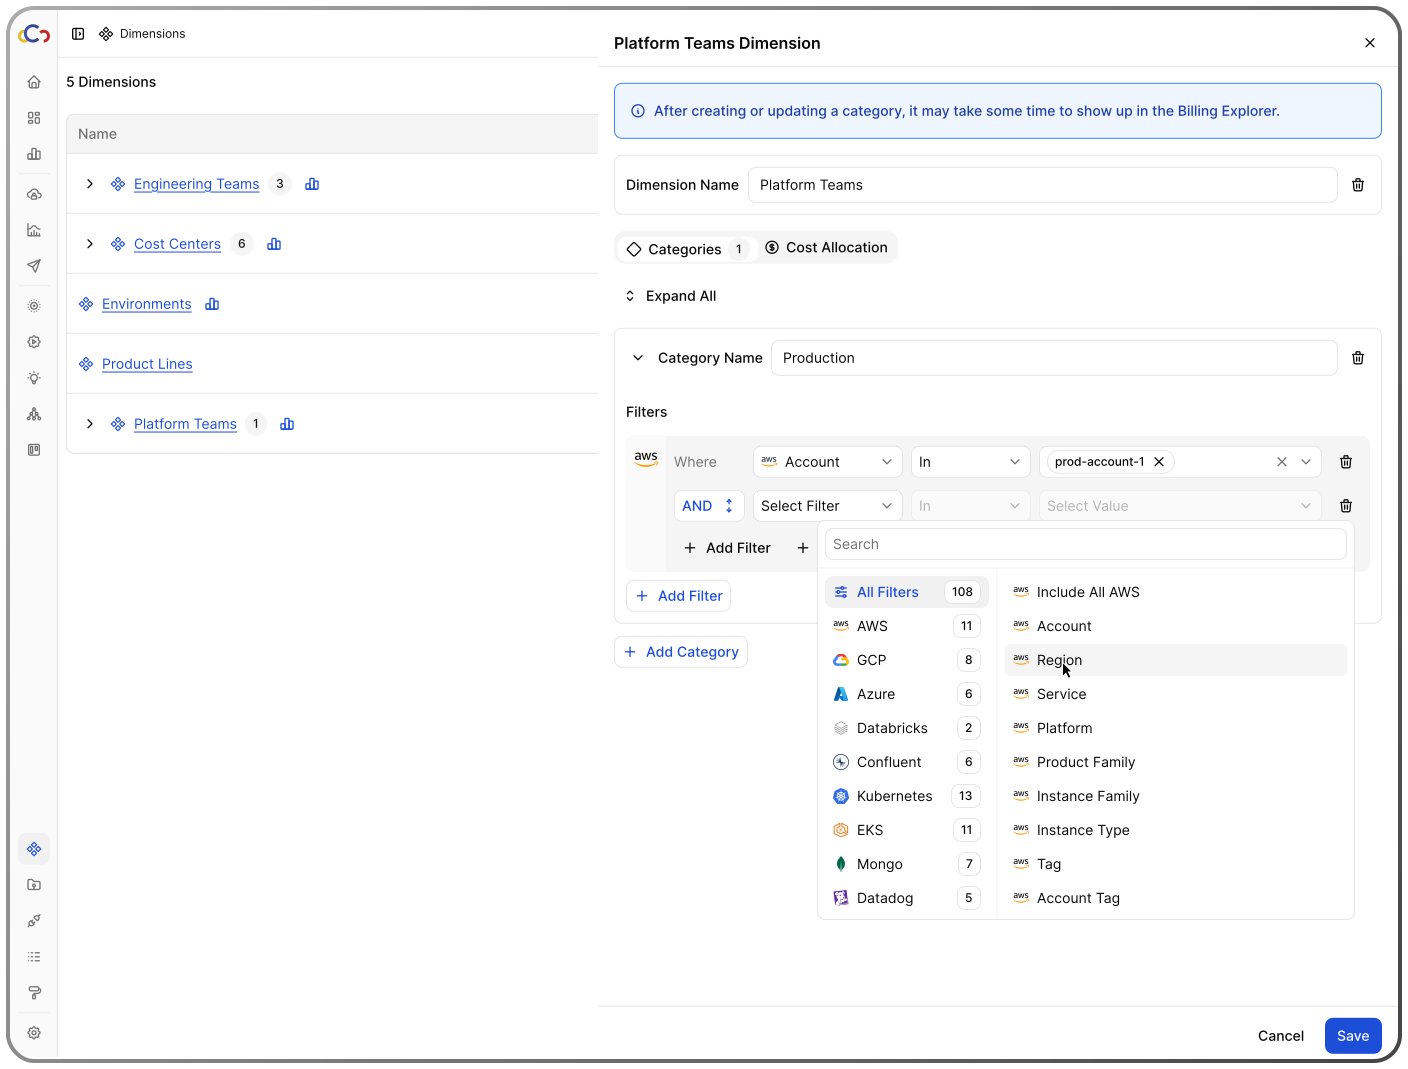
Dimensions walkthrough
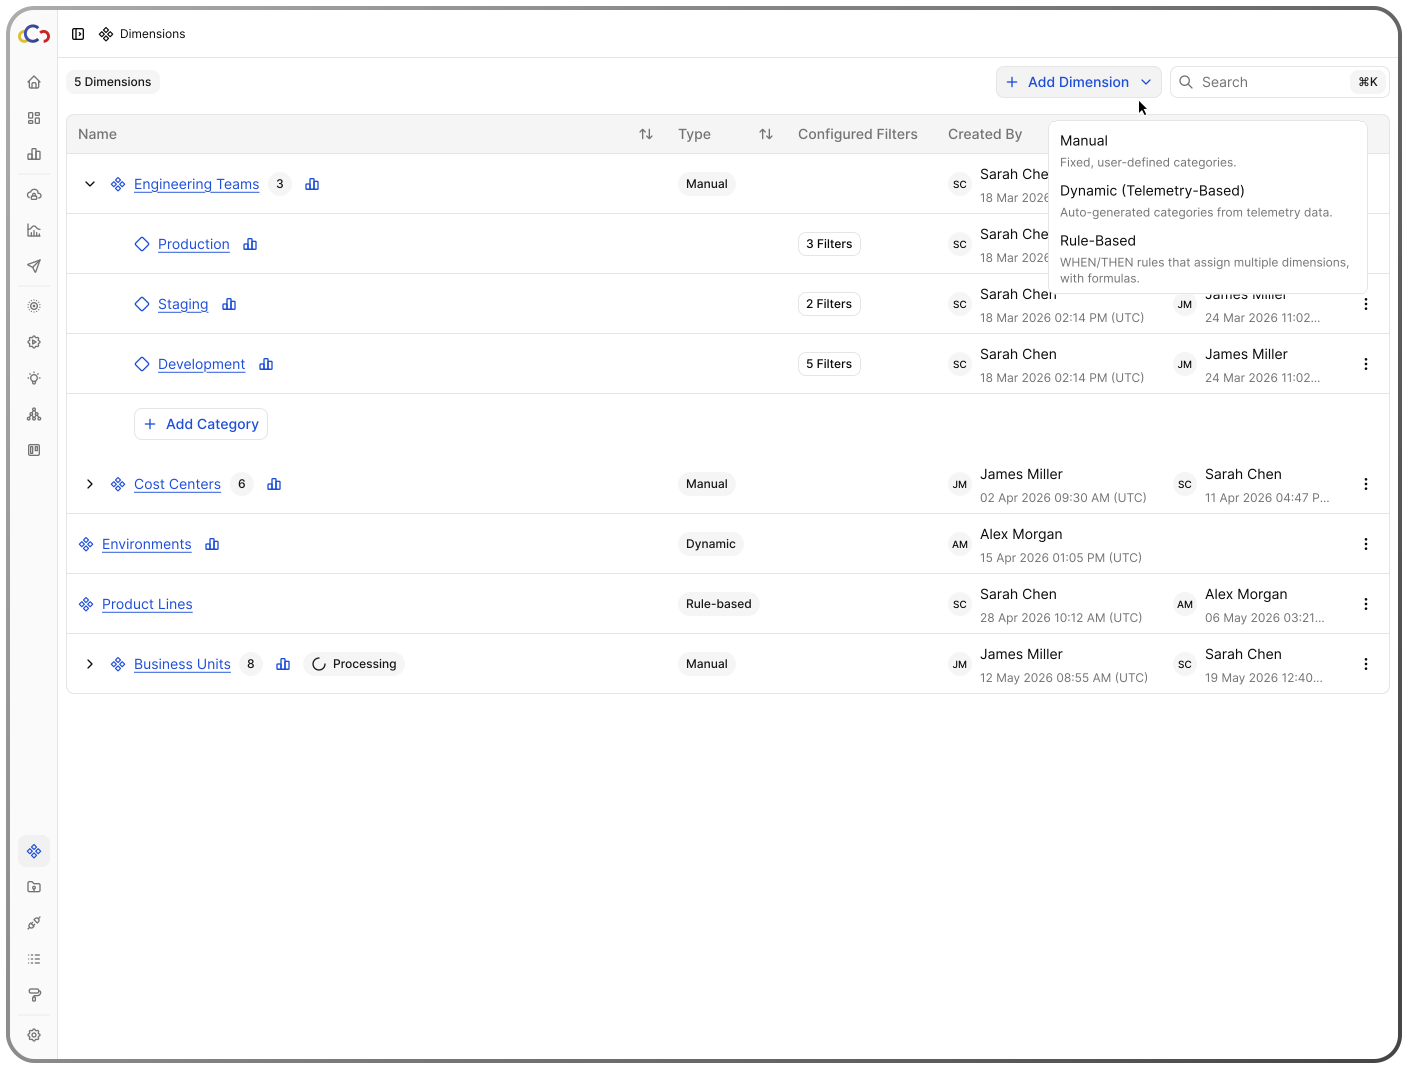
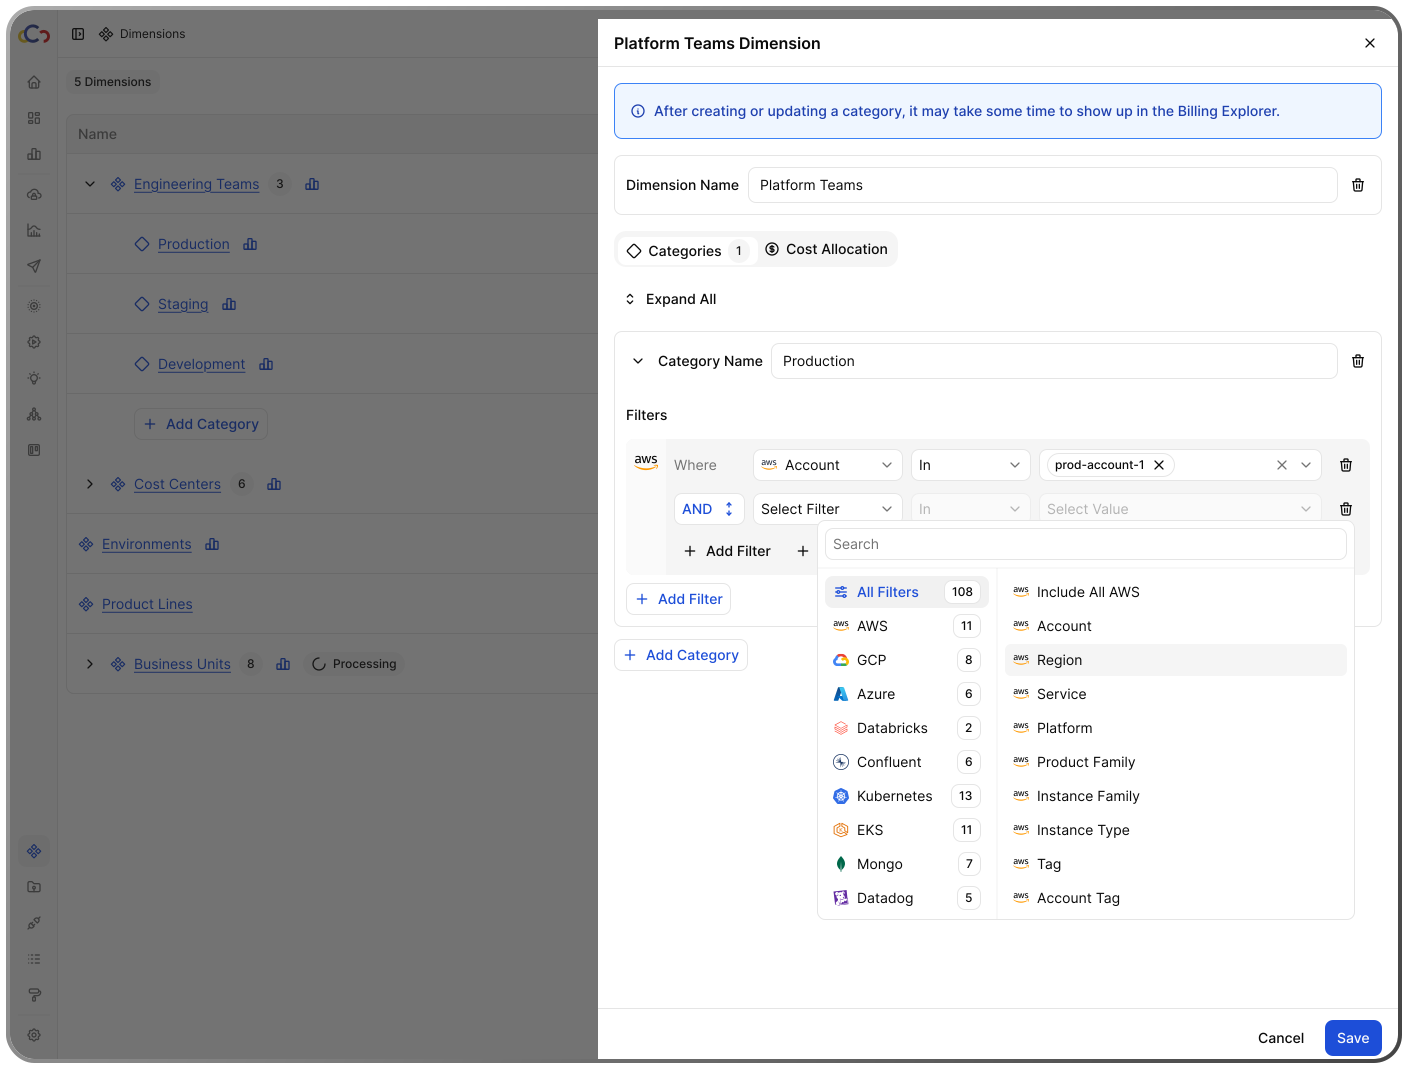
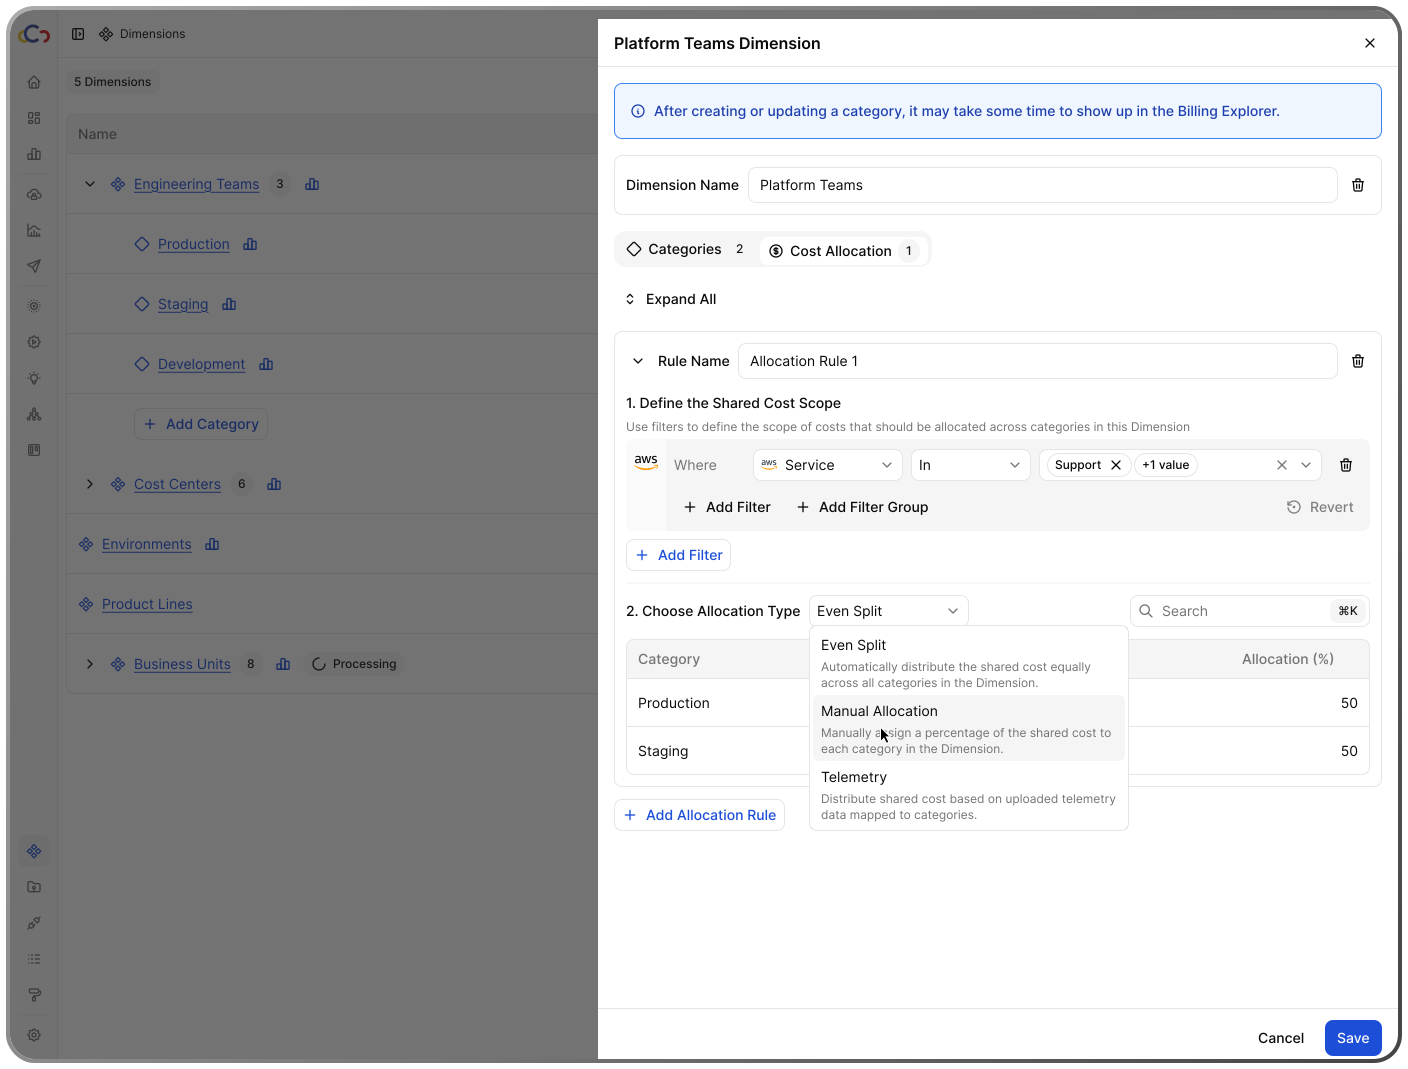
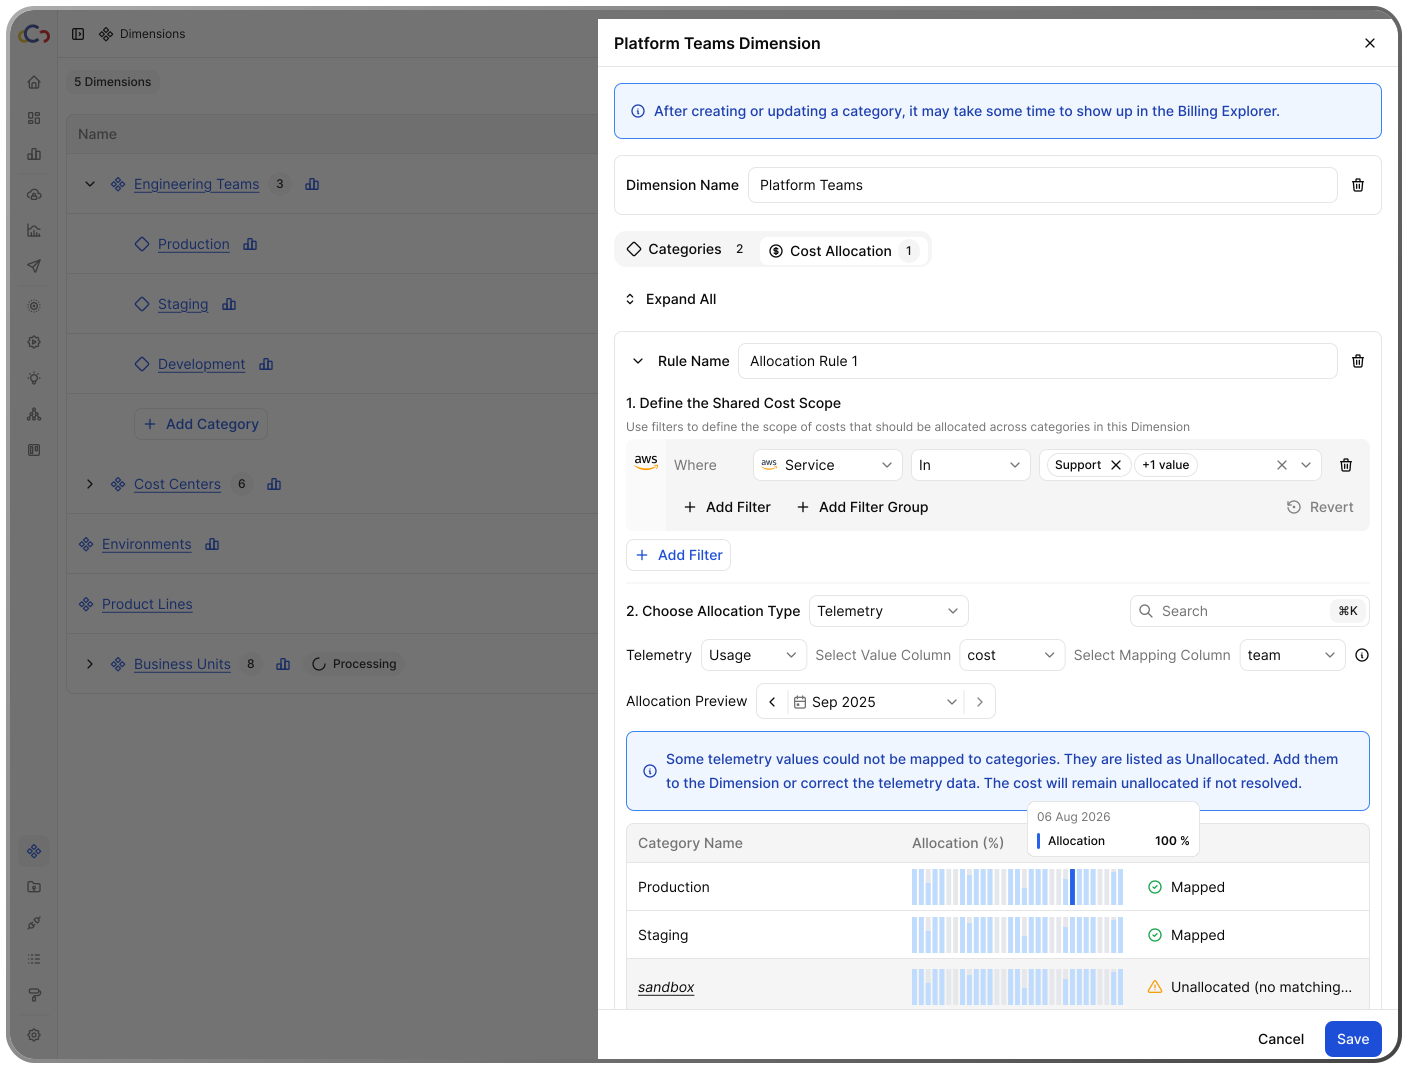
Chapter 1 / 5
See all dimensions in one place
Tap a note to frame it on the screen above.
- 01
See all dimensions in one place
Manage dimensions from a centralized view with category counts, type, and configuration status.
- 02
Reflect processing state clearly
Surface when a dimension is still being processed so users understand when changes will appear in Billing Explorer.
- 03
Choose the right dimension type
Create dimensions as manual, dynamic, or rule-based depending on how the cost model needs to work.
Chapter 1 of 5: See all dimensions in one place
Savings Opportunities
From insight to action
The Problem
Cloud tools surface savings opportunities, but often lack the context needed to act, such as what other optimizations could apply to the same resource. FinOps teams still need to investigate the resource, assess the impact, and find the owner.
The Decision
We designed Savings Opportunities as an action-oriented workflow, so users can evaluate it and decide what to do next in one place.
Why it Mattered
This is where FinOps teams need full confidence before sending a recommendation or taking action on a resource. This extended the core product narrative: explain what changed, connect it to ownership, and make the next step clear.
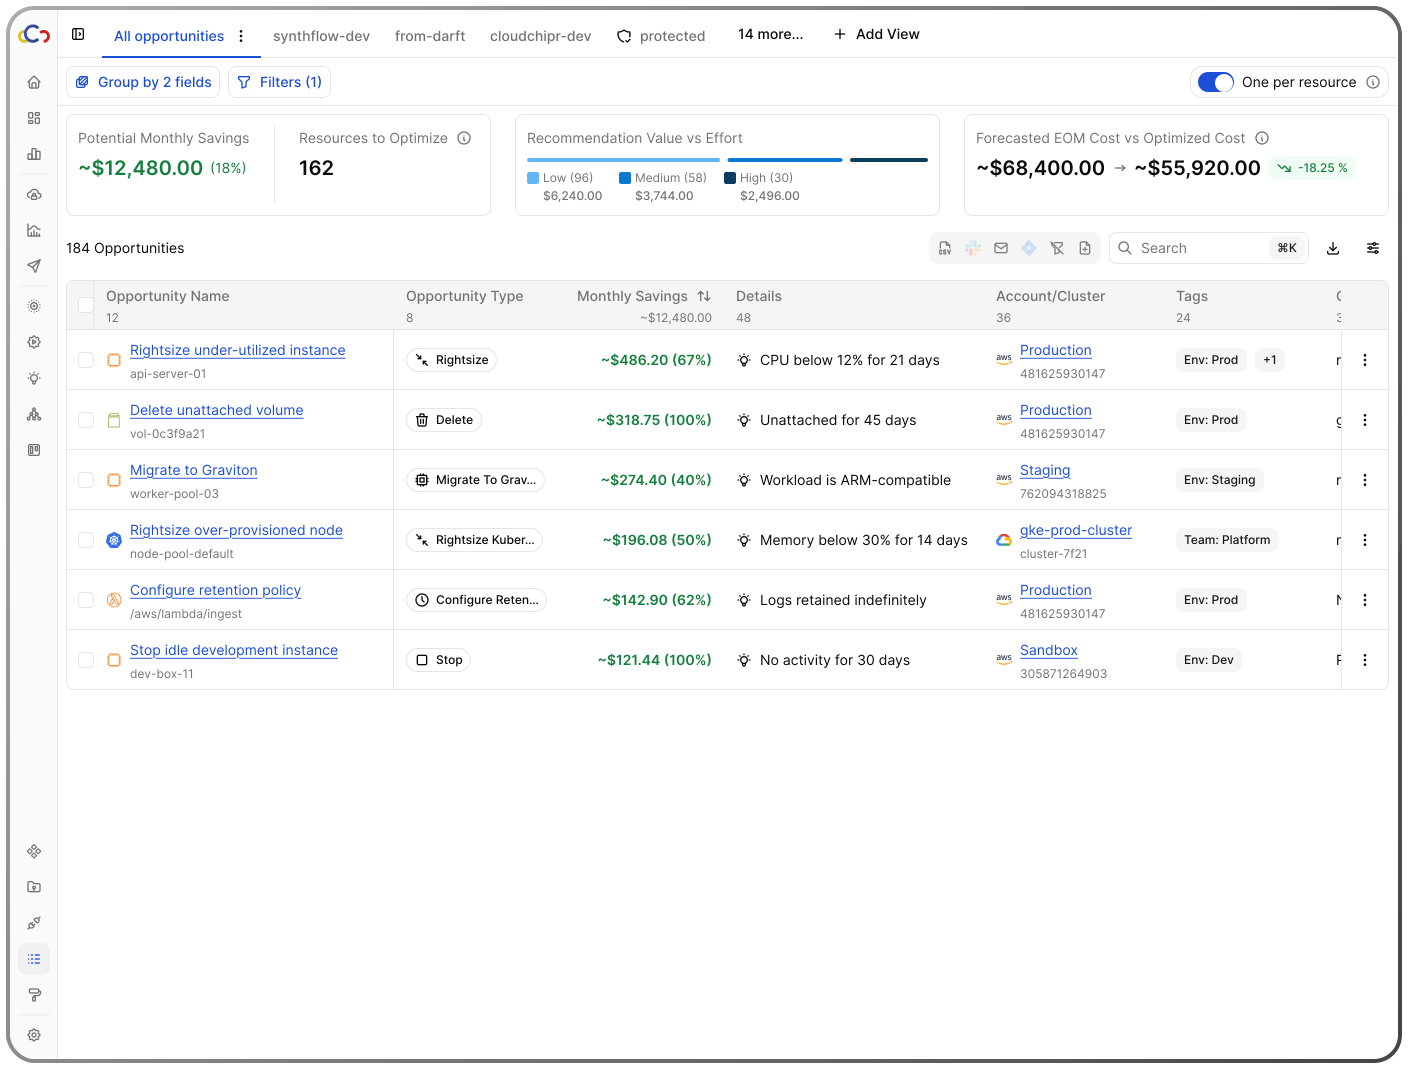
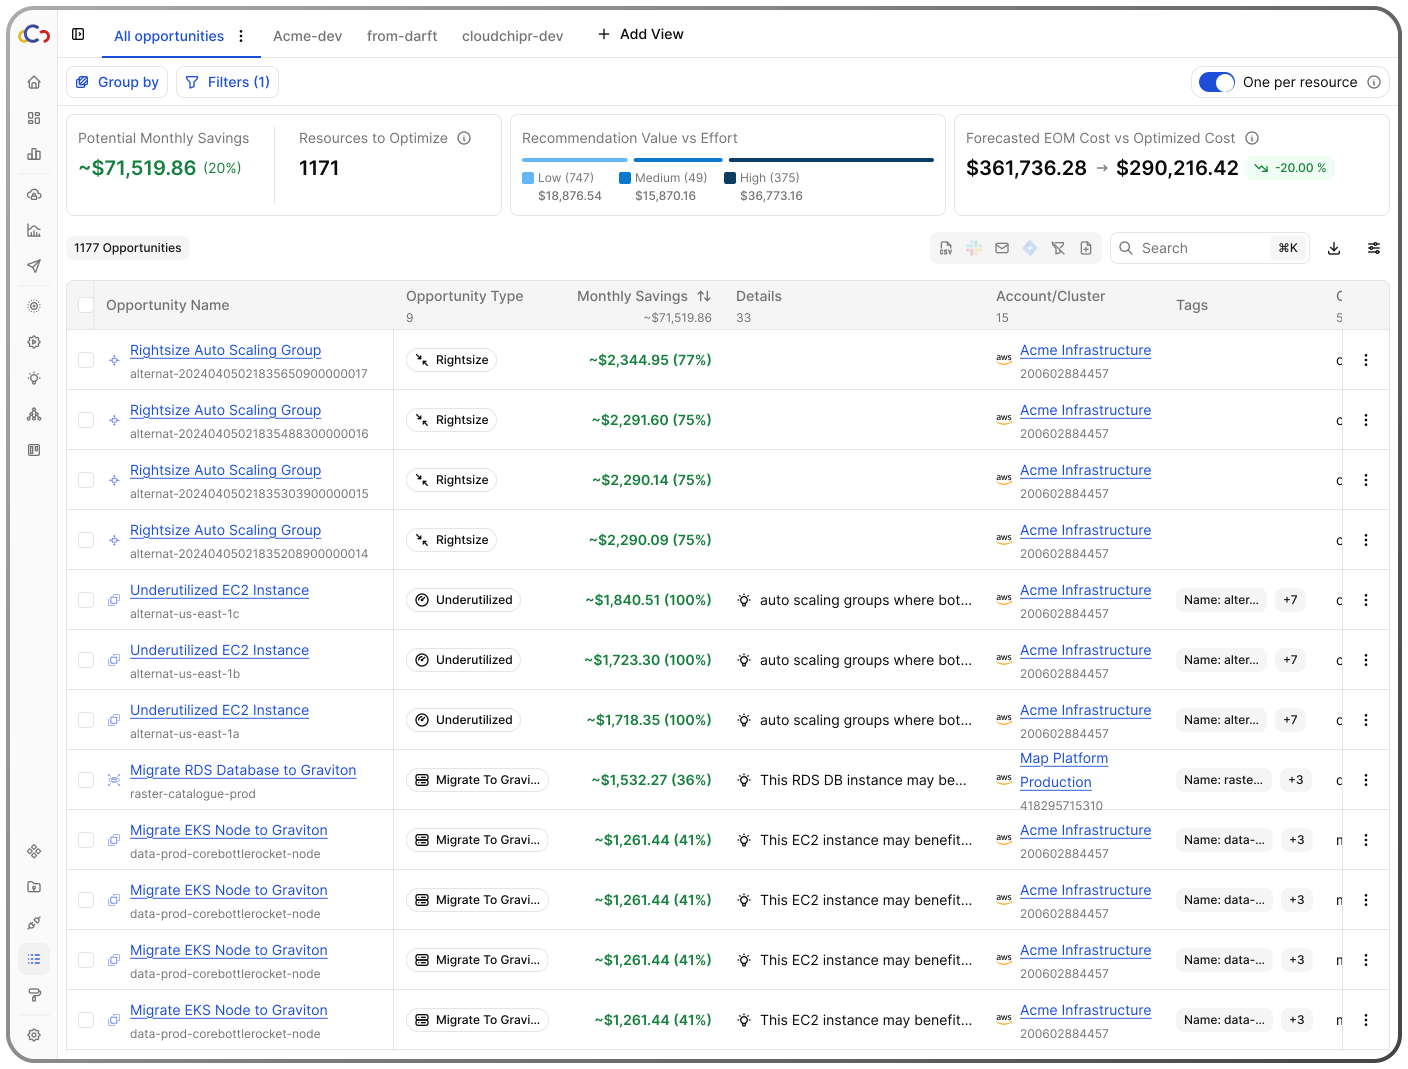
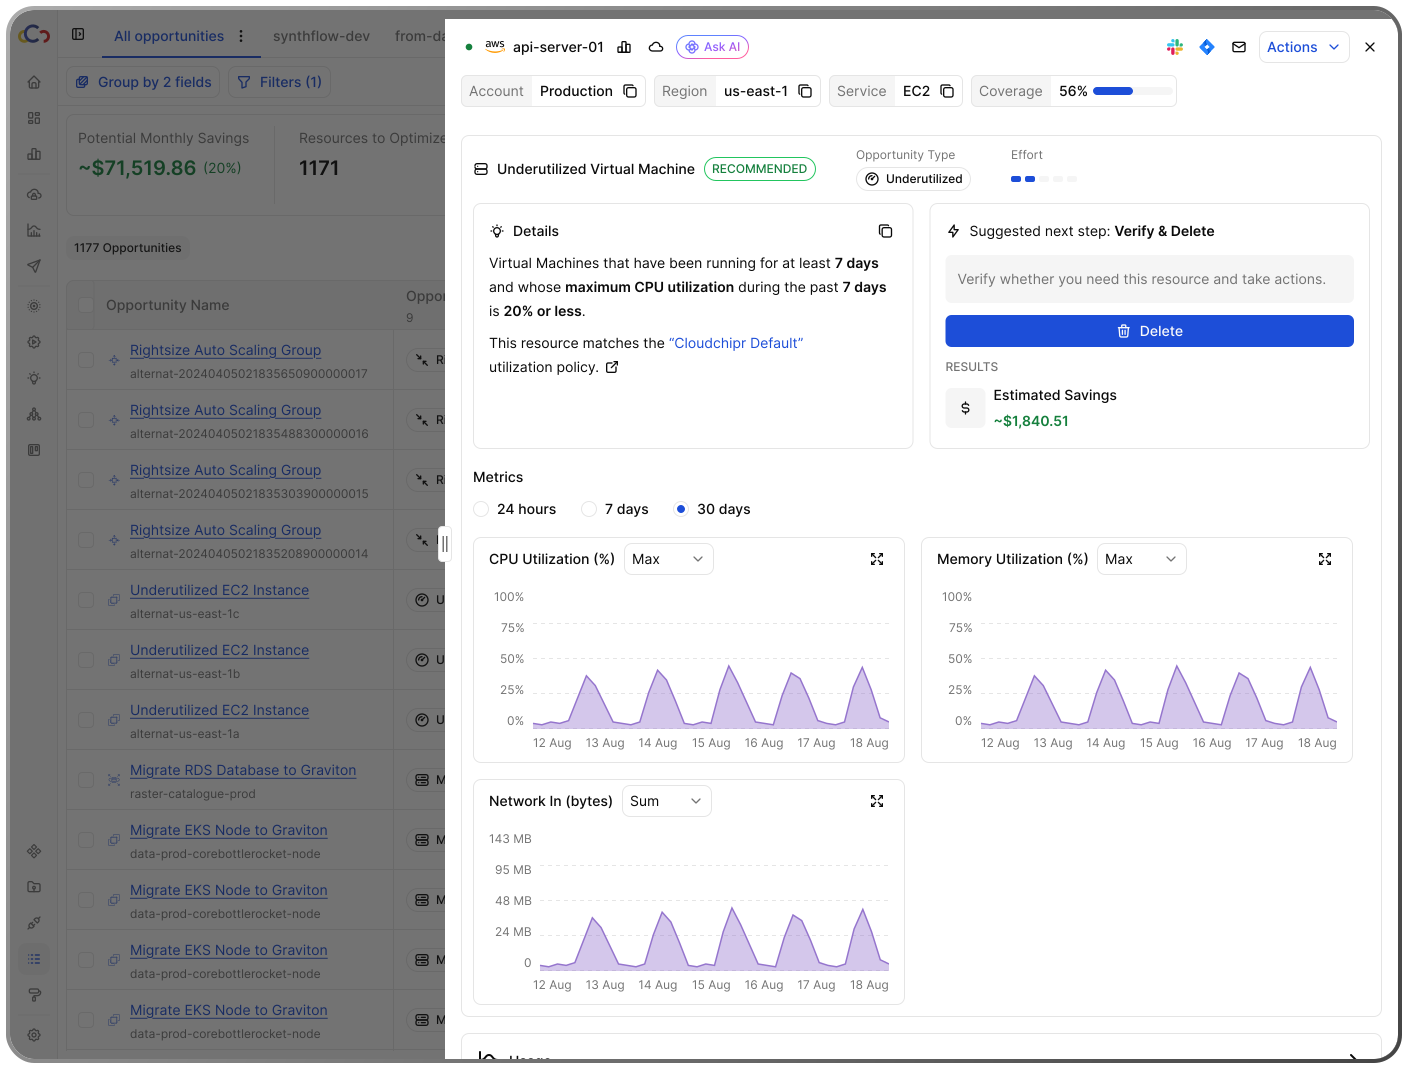
Chapter 1 / 5
Read the savings at a glance
Tap a note to frame it on the screen above.
- 01
See total savings potential
Understand how much can be saved each month and how many resources are affected.
- 02
Prioritize by value and effort
Compare recommendations by expected savings and implementation effort to focus on the highest-impact opportunities first.
- 03
Understand optimized cost impact
See how identified opportunities could change forecasted end-of-month spend before taking action.
Chapter 1 of 5: Read the savings at a glance
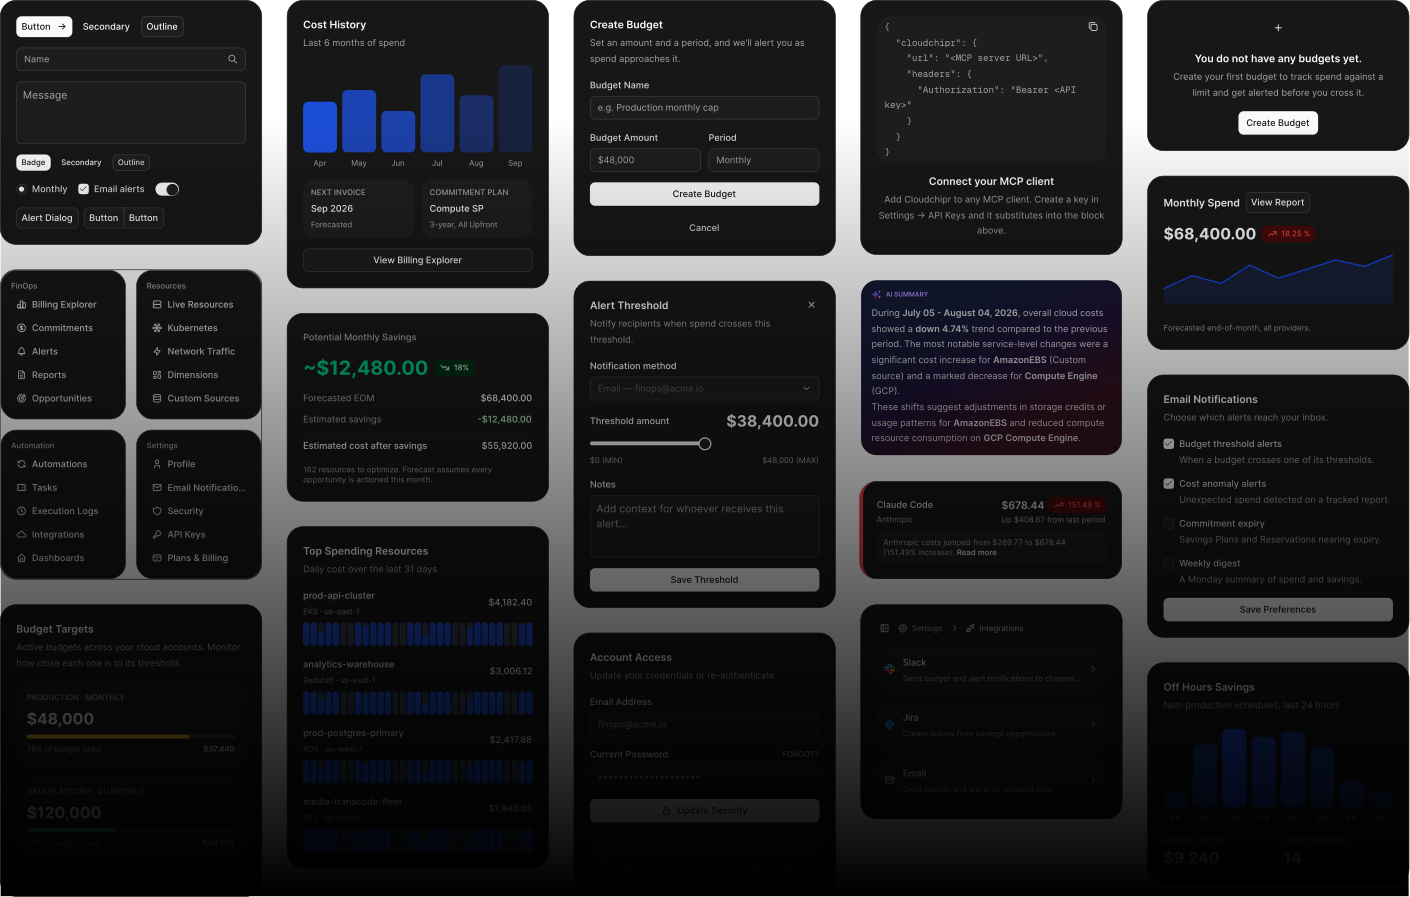
Design system
From customized MUI to an AI-ready design system

MUI
Our customized MUI system supported the product as it scaled, but increasing overrides and component complexity made it harder to maintain.


Shadcn
I'm rebuilding the system with Shadcn to simplify the architecture, reduce custom code, and improve AI-assisted development.
Outcomes
Outcomes
15+
Enterprise contracts where UX was named a deciding factor
300+
Customer requests delivered
More than 300 customer-requested improvements were shipped across the platform.
multi-million ARR
Helped grow Cloudchipr from pre-revenue to multi-million-dollar ARR as founding product designer.
20-40%
Customers reduced cloud costs by 20–40%, contributing to more than $20 million in total savings.
Closing
Deliver fast and Iterate
Cloudchipr required me to operate beyond a traditional product-design role. With no dedicated product manager, I worked across customer discovery, problem definition, prioritization, product strategy, interaction design, visual design, delivery, and iteration. I partnered directly with founders, engineers, sales, support, and customers while taking hands-on ownership of the product experience.
The work reinforced that speed and experience quality are not opposing goals. I used an 80/20 approach to identify the smallest solution that could resolve the most important customer pain, deliver value quickly, and create a foundation that could evolve through real use.
This experience strengthened how I work as a product owner and designer: understand the customer problem deeply, make deliberate tradeoffs, align the team around a clear direction, and stay close to delivery until the solution creates value.
What's next?
I'm looking for a hands-on Lead or Staff product design role at a B2B infrastructure or AI company, where design owns product decisions, not just screens. If that's the role you're hiring for, I'd love to talk.